Running pyqz II
First things first, let’s start by importing pyqz and pyqz_plots.
In [5]:
%matplotlib inline
import pyqz
import pyqz.pyqz_plots as pyqzp
D) Using custom MAPPINGS grids
While pyqz ships with a default set of HII region simulations from MAPPINGS, some (all!) users might be interested in using pyqz with their own specific sets of MAPPINGS simulations. pyqz was designed to be compatible with the grids generated from the awk script provided alongside MAPPINGS.
If one uses the awk script to create new MAPPINGS grids, the resulting
.csv file must be placed inside pyqz.pyqzm.pyqz_grid_dir. The
filename must match what the function
pyqz.pyqzt.get_MVphotogrid_fn() expects for your given set of
parameters, e.g. should you have run a MAPPINGS model for
\(\log\)(P/k)=6.7, plane-parralel HII regions and
\(\kappa=10\), the resulting grid name for the .csv file must
be:
In [2]:
fn = pyqz.pyqzt.get_MVphotogrid_fn(Pk=6.7, calibs='GCZO', kappa =10, struct='pp')
print fn.split('/')[-1]
MVgrid_QZ_pp_GCZO_Pk67_k10.csv
If one does not use the awk script to generate the custom MAPPINGS grid,
then just make sure your model grid matches the format of existing model
grids located in pyqz.pyqzm.pyqz_grid_dir …
E) Resampling the original MAPPINGS grids
By default, 2 times resampled MAPPINGS grids are shipped with pyqz.
These are generated using the function
pyqz.pyqz_tools.resample_MVphotogrid(), which is straightforward to
use:
In [4]:
grid_fn = pyqz.pyqzt.get_MVphotogrid_fn(Pk=5.0,struct='sph', kappa='inf')
pyqz.pyqzt.resample_MVphotogrid(grid_fn, sampling=2)
Success: MVgrid_QZ_sph_GCZO_Pk50_kinf.csv resampled by a factor 2x2 and saved as MVgrid_QZ_sph_GCZO_Pk50_kinf_samp_2.csv
More densely resampled grids can then easily be created by varying the
sampling keyword.
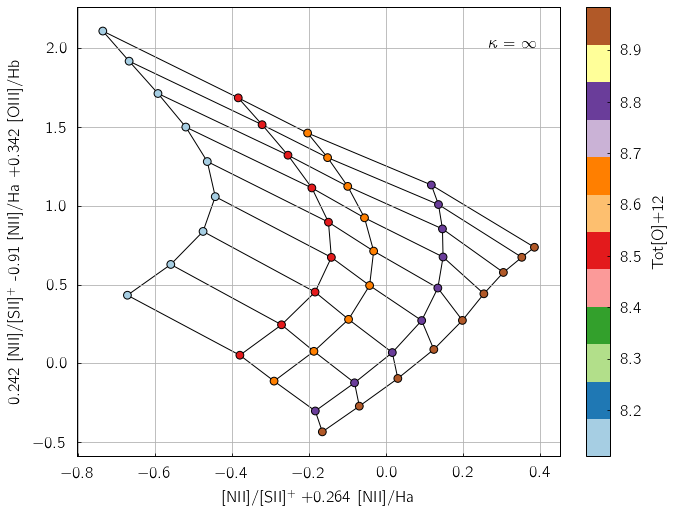
F) Projected 3-D line ratio diagrams
pyqz does support 2-D line ratio diagrams constructed from 3 sets of line ratios (i.e. 3-D line ratio diagrams projected to a given 2-D plane). For example, the diagnostic introduced in Dopita+ (2016) is:
In [8]:
pyqzp.plot_grid('[NII]/[SII]+;[NII]/Ha;[OIII]/Hb',
                     coeffs = [[1.0,0.264,0.0],[0.242,-0.910,0.342]],
                     struct='pp',
                     sampling=1)
In [ ]: